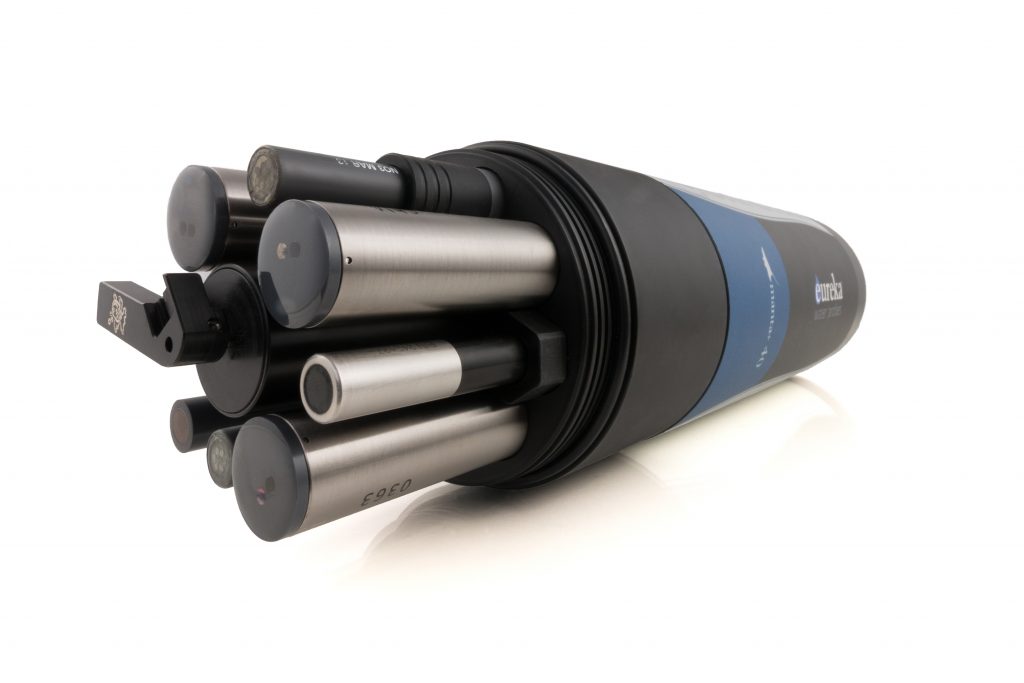
Banyak yang menanyakan bagaimana performa pemantauan sensor Manta Eureka Multiprobes kepada Tim GES. Banyak sekali keunggulan Manta+ tentunya, selain dari kemudahannya untuk digunakan dilapangan, Manta+ juga memiliki kualitas atau akurasi pengukuran yang sangat baik. Berikut tulisan hasil studi dari performa Manta+ yang dibandingkan dengan sensor multiprobes lainnya. Untuk selanjutnya, jika ada pertanyaan, dapat menghubungi Tim GES di admin@gesi.co.id.
—————————————————————————————————————————–
Summary
A recent test of water-quality instruments comprises the most extensive and complete study of multiprobes in Eureka’s 30-year memory – it’s the best information you’re going to find to guide decisions about data reliability. The data present a strong argument that Eureka multiprobes are more likely to be within accuracy specifications, and more likely to track each other, than those of the two other major multiprobe manufacturers.
High-Profile Agencies Cooperate to Test Instruments from the Major Manufacturers
Most “side-by-side” instrument comparisons are one-time tests that don’t provide enough data to make a valuable assessment of performance. To remedy that problem, seven water-quality monitoring agencies conducted seven side-by-side tests over a three-year period. Their skilled operators used more than a dozen instruments, representing the three leading multiprobe manufacturers, to compare thousands of measurements of temperature, pH, conductivity, and dissolved oxygen (DO).
Eureka Shines in Temperature, pH, and Specific Conductance Testing
Figures 1-3 show that typical Eureka data for temperature, pH, and specific conductance fall within Eureka’s accuracy specifications, and follow the trend of the other instruments. Notice especially that Eureka instruments track each other more consistently than do those of the other manufacturers, and have far fewer outlying data points.

Figure 1 – Typical temperature results show that Eureka data fall well within Eureka’s accuracy specification of ± 0.1 C, trend well with the other instruments, and cluster better than the other instrument brands.
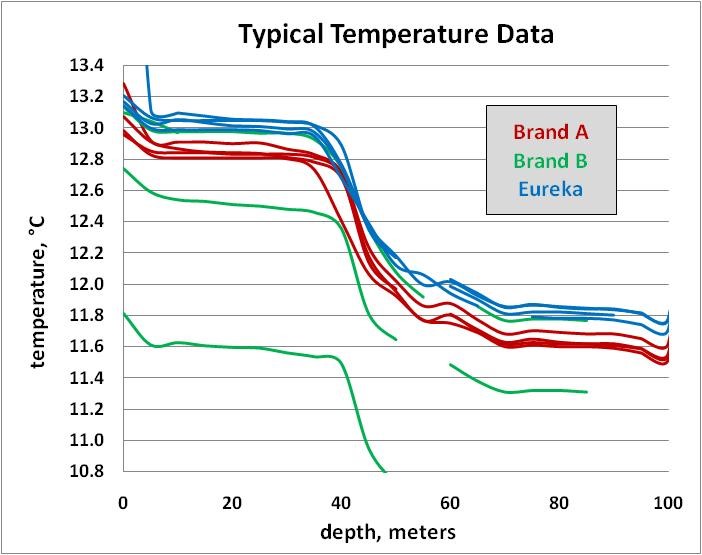
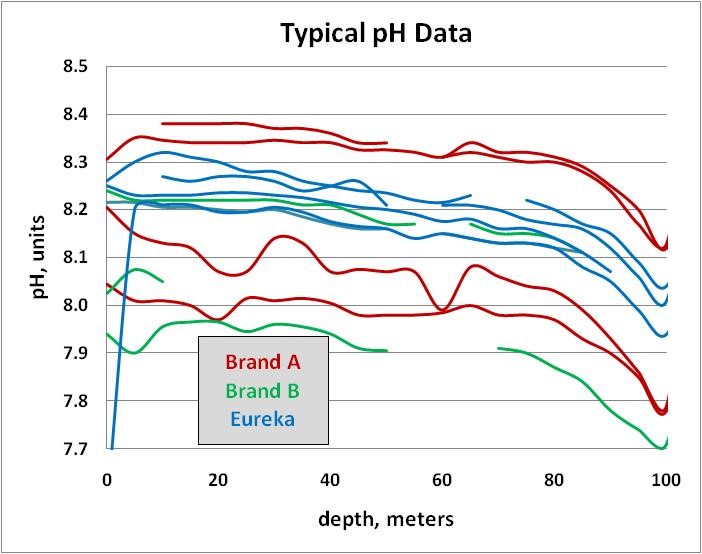
Figure 2 – Typical pH results show that Eureka data fall well within Eureka’s accuracy specification of ± 0.2 pH units, trend well with the other instruments, and cluster better than the other instrument brands.
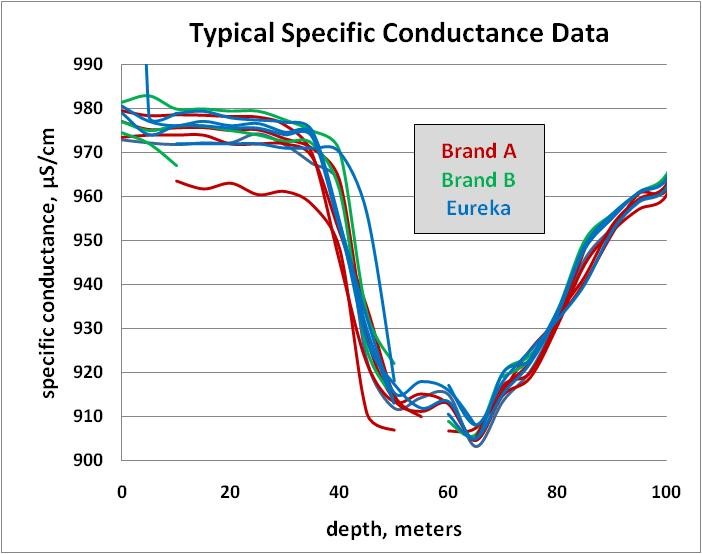
Figure 3 – Typical specific conductance results show that Eureka data fall well within Eureka’s accuracy specification of ± 1% of reading (± 10 μS/cm in this case) trend well with the other instruments, and cluster as well or better than the other instrument brands.
Eureka Looks Even Better in Dissolved Oxygen Testing
Dissolved oxygen is the most important parameter studied, and it is here that Eureka excels. Figure 4 shows a typically wide spread of DO data. The spread at 50 meters water depth, 0.8 mg/l, is twice the manufacturers’ accuracy specification of ± 0.2 mg/l; this is even after the data were normalized to an initial reading of 9.4 mg/l at the surface in order to eliminate the differences in calibrations. The Eureka data spread is about 0.2 mg/l; the other manufacturers’ data spread 0.4 mg/l or more.
Extensive examination of this data and DO data from the other tests led Eureka to hypothesize that DO sensors suffer from sensitivity to water pressure. As a result, instruments from each manufacturer were sent by test participants to Eureka for pressure testing. Eureka engineers built a unique pressure tank that accommodates cabled multiprobes from all manufacturers. Figure 5 shows the sensitivity of the three manufacturers’ optical DO sensors. Eureka had the smallest sensitivity, +0.22 mg/l at 90 meters of water pressure; brands A and B had sensitivities of -0.31 mg/l and -0.76 mg/l, respectively.
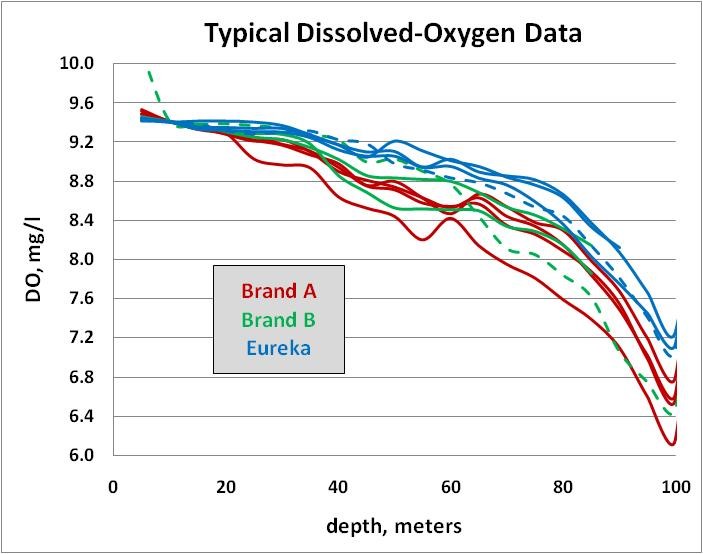
Figure 4 – Typical DO results, normalized to eliminate calibration differences, show that only the Eureka data fall within the typical accuracy specification of ±0.2 mg/l. The excessive, overall data spread among all instruments, 0.8 mg/l, indicates a fundamental problem with DO measurement.

Figure 5 – Instruments from each manufacturer were delivered to Eureka for testing in December 2009. Eureka’s optical DO sensor had the least sensitivity to pressure. The sensitivities of the other sensors are enough to cloud judgments about water quality in deep waters.
Notes
These field data above came from the one test date that included at least three instruments from each manufacturer, but are typical of all data. This is a good study with an unprecedented number of instruments and data points. But considering variables, such as calibration procedure and station times, this data set alone does not prove any particular point. But it’s the best data you’re going to find to guide decisions about data reliability. This summary was written in February 2010.
Sumber: Eureka Manta (www.waterprobes.com)